Rate and Volatility Feeds
Chainlink rate and volatility feeds provide data for interest rates, interest rate curves, and asset volatility. You can read these feeds the same way that you read other Data Feeds. Specify the Rate or Volatility Feed Address that you want to read instead of specifying a Price Feed address. See the Using Data Feeds page to learn more.
The following data types are available:
Bitcoin Interest Rate Curve
Lenders and borrowers use base rates to evaluate interest rate risk for lending and borrowing contracts, asset valuation for derivatives contracts, and an underlying rate for interest rate swap contracts. Bitcoin Interest Rate Curve Data Feeds provide a base rate to assist with market decisions and quantify the risks of using certain protocols and products based on current and predicted baseline interest rates. The curve’s normalized methodology and daily rates introduce more consistency and predictability to the ebb and flow of digital asset markets. Bitcoin Interest Rate Curve Feeds incorporate a wide range of data sources such as OTC lending desks, DeFi lending pools, and perpetual futures markets.
To learn more about the use of these interest rate curves in the industry, read the Bitcoin Interest Rate Curve (CF BIRC) blog post.
See the Rate and Volatility Feed Addresses page to find the Bitcoin Interest Rate Curve feeds that are currently available.
ETH Staking APR
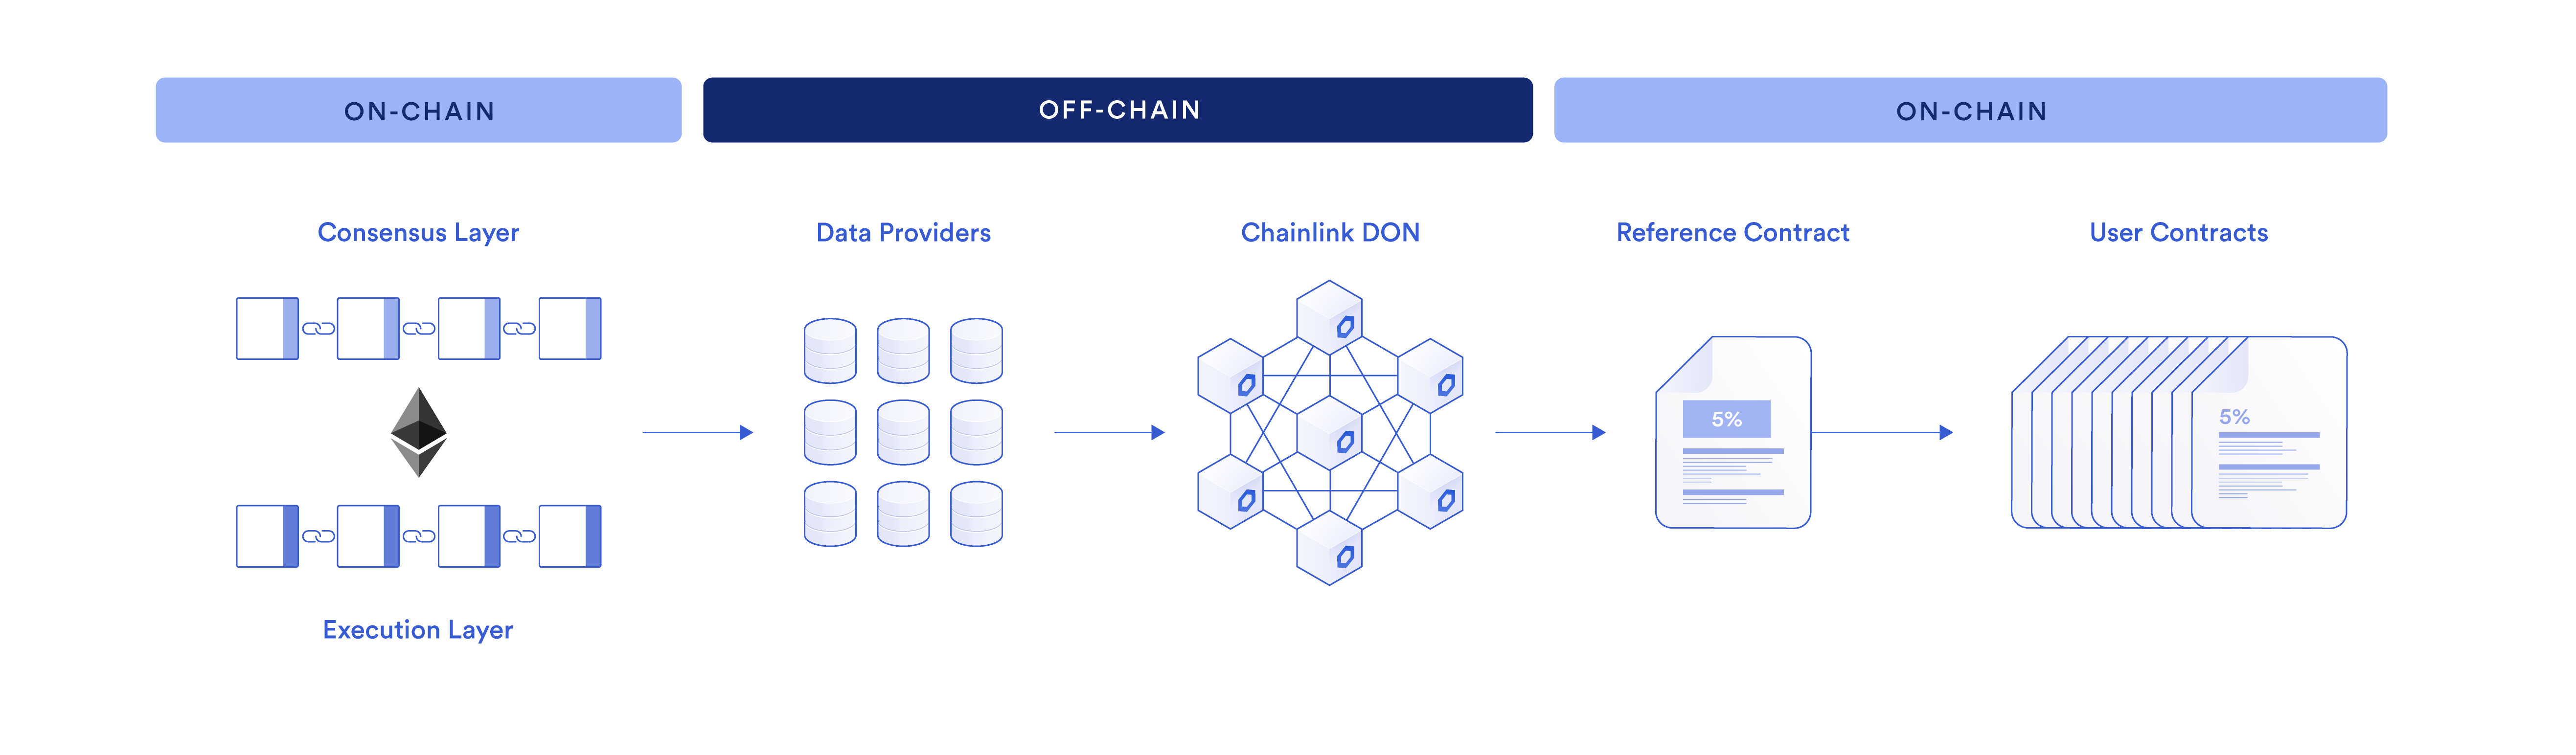
The ETH Staking APR feeds provide a trust-minimized and tamper-proof source of truth for the global rate of return from staking as a validator to secure the Ethereum network. The annualized rate of return is calculated over 30-day and 90-day rolling windows. Data providers use offchain computation to calculate returns at an epoch level, reach consensus on the APR, and then write the results onchain to be used by decentralized protocols and Web 3 applications. Feeds are currently configured to update at a minimum of once per day.
See the Rate and Volatility Feed Addresses page to find the ETH Staking APR feeds that are currently available. If you have questions or would like to request an enhancement to ETH Staking APR feeds, contact us using this form.
Realized volatility
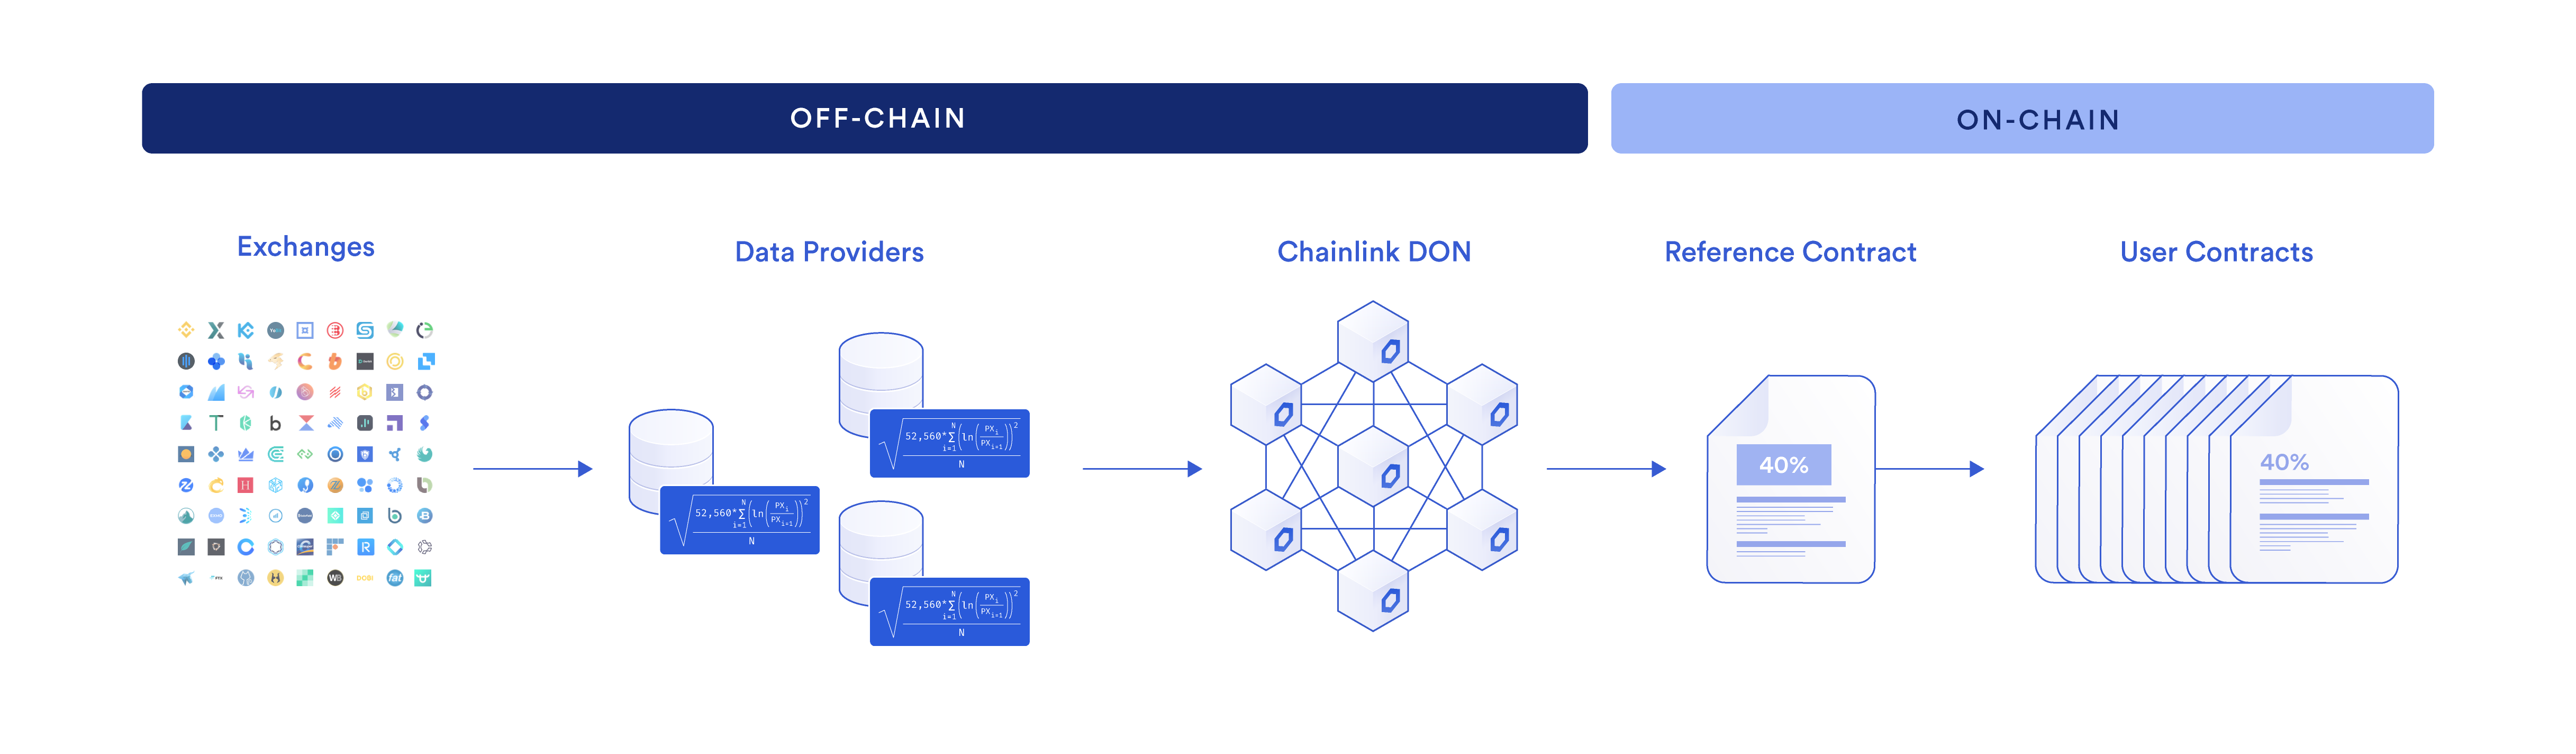
Realized volatility measures asset price movement over a specific time interval. This value is expressed as a percent of the asset price. The more an asset price moves up or down over time, the higher the realized volatility is for that asset. Please note that realized volatility is not the same as implied volatility, which measures the market’s expectation about future volatility typically derived from options markets.
Each data feed reflects the volatility of an asset over a specific rolling window of time. For example, some data feeds provide volatility data for the last 24 hours, 7 days, and 30 days of time. You can compare the data across these windows to infer whether the volatility of an asset is trending up or down. For example, if realized volatility for the 24-hour window is higher than the 7-day window, volatility might increase.
The same high-quality data providers used in Chainlink’s price feeds sample price data every 10 minutes to refresh volatility estimates. onchain values are updated when the feed heartbeat or deviation threshold is met.
See the Rate and Volatility Feed Addresses page to find heartbeat and deviation information for each feed. If you have questions or would like to request an enhancement to Realized Volatility Feeds, contact us using this form.